
I can’t wait to share the results of my football prediction model with you. I promise to contain my excitement and stick to the facts. The model took much more time than initially anticipated. It took me about 4 months from idea to the somewhat working model. My hands are still sore from all copying and pasting. The findings, however are quite promising and a few back tests showed to be quite profitable.
But first, a quick refresher: this football prediction model is based on relative player salaries (for methodology, see part 2 of this blog). Why did I not use a more traditional xG prediction model? I have outlined their limitations in part 1.
The process of Creating the Football Prediction Model for Serie A
My goal was to analyze at least 5,000 matches and estimate how often more expensive football squads win at home and away. I had to go back and find Serie A wage bills that are 10-12 years old. The more the merrier. Tiresome internet browsing revealed 11 years worth of data. Italy’s Serie A seasons from 2006/2007 up to 2017/2018. There were a total of 4180 matches that were analyzed. A bit short of my goal but it will do. The aim was to learn the relationship between the player salaries and match outcome.
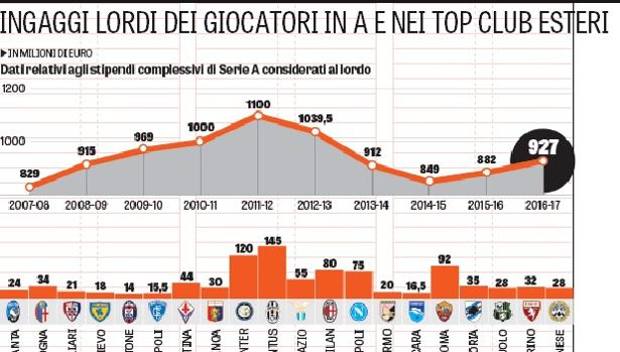
Team wages were taken from La Gazzetta Delo Sport. Here’s a sample salary report that the model uses. I almost had to learn Italian to find them all 🙂
The model was intended to simulate various what if scenarios. What if the home team outspends the visitors four-fold, how often do they win? (62% of the time) How often do they tie? (22.5%) and are those probabilities reflected in the betting market (Yes, but NOT always).
The key metric had to be simple, so I called it the ratio. Simply put, it’s the wage bill of a home team divided by the visiting team.
After looking at 4,200 matches, I broke them down into categories of about 300 matches each, sorted by the ratio.
Quick Video Overview of the Football Prediction Model
The Findings
Here’s a quick snapshot of results. To paint a picture, lets sort data by ratio and break the data set into clusters. Each cluster representing about 300 matches. This is a fairly small sample size. We then do a quick pivot table in Excel and arrange the probability of match outcome in each of the clusters. Here’s what we get:
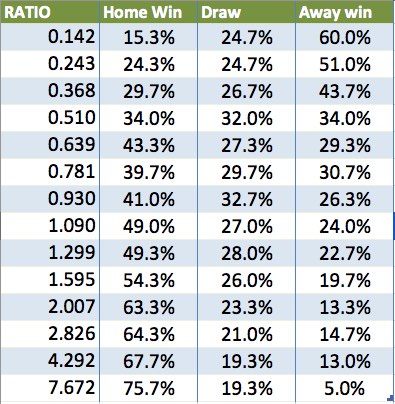
Intuitively it makes sense. When teams have have similar wage bill (Ratio ~1), the home team will win 49% of the time. The draw will occur 27% of the time and 24% of the time away team will win. These are the matches like Napoli vs Inter and Verona vs Parma in 2015.
But look what happens when you move away toward the edges of the grid. When a large outsider plays an away game, the team only has a 5% chance of winning (Milan vs Capri in 2016 for instance). But the visiting team will try very hard to contain the favourite. As a result the probability of the draw is 19%.
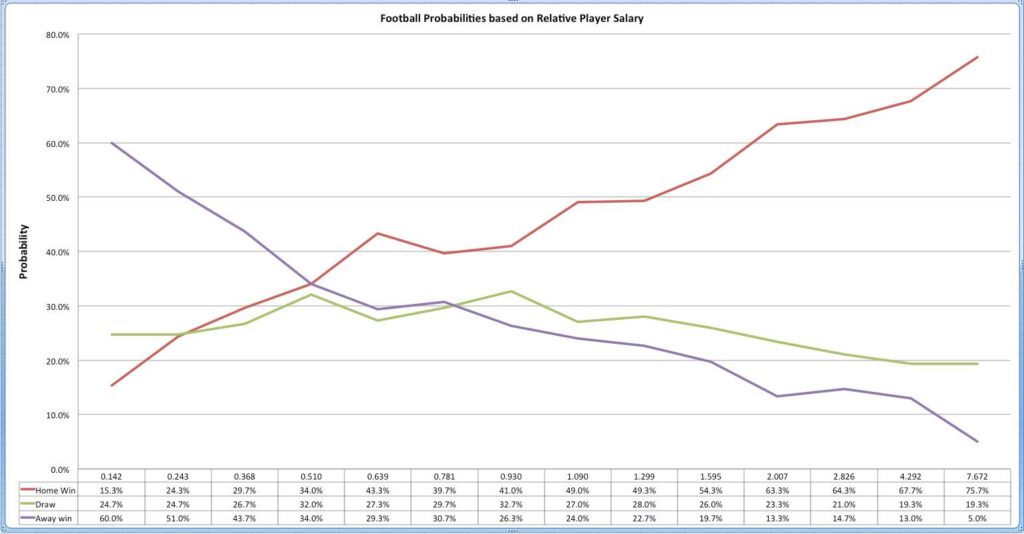
Quick graphical representation. We see a few bumps but I attribute it to smaller sample size.
How does this Model compare to the Bookies?
On average, the bookmaker odds are aligned with the statistical model. There are however some irregularities and trends. A few clusters are overvalued by bettors and a few are undervalued. Or so it seems. Also, certain matches have a very large gap between statistical probability and the bookies. Lets not forget we are looking at the static model and this will happen occasionally. A star player gets injured. The team decides to give some rest to the 7 starting players. Or perhaps the stadium is banned for fan behaviour. All of these factors would influence the odds significantly. However on few occasions the model uncovers some profitable betting opportunities.
But it’s a topic for another blog post and a long analysis. If you want to see a separate post about it, just drop me a note or simply comment below.
Oh, and I am pretty sure I have discovered a fixed match in Serie A at the end of the season. Obvious I can’t prove it was fixed but the odds were VERY suspect.
Football Prediction Model Back Tests
What the point of all this hard modelling work without exploring monetization opportunities, right? 🙂 The formula was simple: look for value bets in historical performance data. For this to be a good test, two separate leagues other than Serie A had to be used. I back tested it on one season of EPL games and one season of La Liga. Thanks to Football Data, they had statistical results not only of the matches, but also the bookmaker odds.
Simulation consisted of looking for the a) difference between Pinnacle odds and statistical probabilities of the model and b) probability of event ocuring. Every time system showed an edge, I instructed the spreadsheet to allocate a bet based on probability of an event. If this is confusing, take a quick look at the video.
Bet Criteria: Only bet if expected bet value is >15%. I tried various values, but 15% looks optimal.
Bet amount: I used flat bet amount depending on the probability of outcome. I wanted an average stake to be near $20, so simply multiplied probability of an outcome by $40. If a home win had a value of >15% and 67% probability of occurring, I would stake $26.8 ($40*.67)
Starting Bankroll: $500 for each test
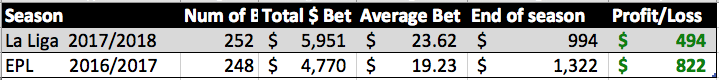
Both scenarios were profitable, which is fantastic news! La Liga was profitable from week one and kept going, but with EPL was more volatile and by the end of October the bankroll went down to $248. It got back to $500 range by mid November. If I was betting in real life, I would be nervous with two losing months in a row. But nevertheless, if I started with $1000, I would be $1,316 richer.
For the purposes of this back test, I didn’t increase the bets as the bankroll got bigger, I didn’t use Kelly Criterion or any of the complex bet allocations. I am sure that with some modelling, I can reduce the risk and optimize for profit.
So Stan, can you REALLY beat the bookies with this football prediction model?
That is a million dollar question now, isn’t it? I think I can. With time. Please understand that this is a very simplistic model that does not account for important factors like injuries, team motivation, player form, etc. My goal is to take it to the next step. That’s a totally different can of worms, but I am prepared. I think 🙂
P.S. if I stop blogging about this model in the near future, I am probably making money with it. Or I just stopped blogging. Which is less likely 🙂
P.P.S. While the model is fairly basic now, I don’t mind sharing it with readers. All 11 of you! But first I have to figure out how to upload Excel spreadsheets to the blog 😉 You could really motivate me by leaving some comments below in case you are interested;)


 – Part 3")


I like your model and have been working on some statistical modelling myself to predict outcomes of matches.
However, aside from the issue of players being injured or suspended which you’ve covered, one area that I thought it might be worth looking at is the comparison between managers salaries and whether that has an impact.
After all, the top managers are as sought after as the top players, and although they don’t have as much of an impact as the team as a whole, they have more impact than any one individual player.
Perhaps it might be worth modelling the managers salaries in a ratio and using a weighting to adjust the final predictions?
Chris, this makes perfect sense, I don’t know why I haven’t looked at it. Managers are as big or bigger than any given player, so this should certainly be factored in.
Any idea what a reliable source of Manager’s salaries would be?
What kind of statistical modelling are you looking at?
Congratulations on the excellent idea of creating a model based on the players’ salaries.
I would like to test the model in the Portuguese League.
Could make the Excel file available.
Thank you
Sure let me get back to you in the next few days. Is this email good for you?
Hello, Stan Ivanov.
Please send to this e-mail:
manuel.mail@sapo.pt
Thanks very much
Manuel
Hi Stan,
congratulation for the excellent work!
Could be useful to integrate this model with a social sentiment analysis, analyzing for example the posts/tweet of the clubs and not only ones, in order to adjust the final prediction.
I would like to test your model with a new 2020-2021 Serie A season and I will happy if you could make your excel available to me at info@antoniobello.com
Let me know!
Regards,
Antonio
Dear Stan,
Could You please send me the model to test it out?
If not, how much does it cost (if You are selling it)?
Much Appreciated!
Wishing You the best Thursday,
Boris