Creating a Better Football Prediction Model – Part 1
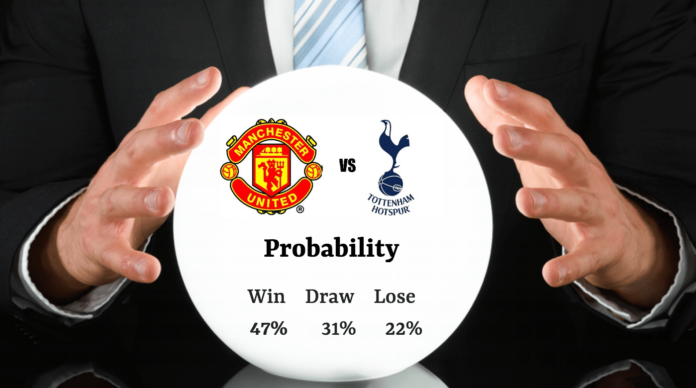
I have never bet on sports in my life. Wait, I am lying. There was a $10 pool at my workplace during the 2006 World Cup and our pool at the FBA in 2018. I didn’t do too well in the first and the judgement is still out on the second. But it made me curious: how can someone assess the probabilities efficiently? And since I am a bit of a nerd, I have started looking around for probability models of football matches.
Existing Football Prediction Models
Scholars built some of the models I found. Others were developed by online betting communities with the aim to beat the bookies. Some are just ridiculous guessing attempts aka the crystal ball approach on 20 tabs of a spreadsheet. I have quickly learned that most models that make any sense are based on statistics such as shots on goals, goals for/against, possession, passing completion and the most sophisticated of them all – Expected Goals.
Ball possession is not a strong predictor of winning, nor are pass completions. There is a positive correlation but it’s not that great. Which statistics do experts looks at? Most of look at historical goals. Here’s a quick video of Peter Webb – a full time sports trader talk about his predictive model. If we take it one step further, we see that best models not only look at historical goals, they look at historical quality of the chances. aka as Expected Goals Model.
The Problem with Expected Goals for Football Prediction Model
I really liked the expected goal framework and I can see how it can be very useful inside of a football club. It did however prove to be quite poor in predicting football game outcomes. The variance in stats from one season to the next is simply too large. I think it happens for a number of reasons: squad changes, tactics changes, different coach etc. Some teams are fairly consistent from season to season, but others are not. I quickly pulled expected goals statistics from differentGame blog for the 2014/15 season and compared it to the 2015/2016 season. Lets take a look:
| 2014/2015 | 2015/2016 | Diff | Diff | |||
| xG For | xG Against | xG For | xG Against | xG for | xG Against | |
| Chelsea | 69.97 | 34.37 | 51.26 | 49.67 | -37% | 31% |
| Man City | 71.91 | 38.34 | 66.3 | 37 | -8% | -4% |
| Arsenal | 70.12 | 37.47 | 69.3 | 38.09 | -1% | 2% |
| Southhampton | 51.55 | 35.84 | 54 | 42.56 | 5% | 16% |
| Newcastle | 45.05 | 48.81 | 43.5 | 54.38 | -4% | 10% |
| Swansea | 45.03 | 58.02 | 39.55 | 51.22 | -14% | -13% |
As you can see some teams are not consistent at all. Chelsea created much fewer chances and allowed the opposition to shoot from better positions. So, if you were building a predictive model during the summer of 2015, this inconsistency in performance would kill it.
Why does it happen? Expected goals look at overall team efficiency and don’t account for for individual contributions. Thus, if a star player leaves a team or is injured, the model doesn’t take that into account.
Is there a better way of predicting outcomes of a football games? I think there is! Lets walk through it together in in Part 2 ->


![How to Scout the Opposition in Football – Eredivisie S.B.V. Excelsior Report [PDF Download]](http://intelligentfc.com/wp-content/uploads/2018/07/Excelsior-Football-Scouting-Report-218x150.jpg)

![How to Scout the Opposition in Football – Eredivisie S.B.V. Excelsior Report [PDF Download]](http://intelligentfc.com/wp-content/uploads/2018/07/Excelsior-Football-Scouting-Report-100x70.jpg)


